- Home
- Project Apri sottomenù
- UPLAND ARCHAEOLOGY WORKSHOP Apri sottomenù
-
Abstracts
Apri sottomenù
- Wieke de Neef (Ghent University / Otto-Friedrich University Bamberg)
- Francesco Carrer (School of History, Classics and Archaeology, Newcastle University (UK))
- Umberto Tecchiati (University of Milan)
- Tesse Stek (KNIR - Royal Netherlands Institute in Rome)
- Riccardo Rao (University of Bergamo)
- Fabio Saggioro, Nicola Mancassola (University of Verona)
- Roberto Maggi, LASA (Laboratorio di Archeologia e Storia Ambientale), University of Genova
- Andrea Cardarelli, Andrea Conte (University of Rome "La Sapienza")
- Federico Zoni (University of Bergamo)
-
Short presentations
Apri sottomenù
- SHORT PRESENTATIONS PROGRAMME
- Putzolu et al., The 2nd Millennium BC in the northern Apennines
- Giorgi et al., New insights into the upland landscape of ancient Epirus, Southern Albania
- Carra, Subsistence economy in the Bronze Age in the northern Apennines upland
- Gaucci et al., Mapping mobility in the Apennines: The Reno Valley between the 6th-4th century BCE and the contemporary period
- Cirelli et al., Insediamenti di altura nell’Appennino Romagnolo e Toscano nel medioevo
- Betori et al., Amatrice: da castello a città
- Del Fattore, Upland landscapes and settlements strategies in the Central-Southern Apennines (1000 BC-2023 AD)
- Conversi et al., The site of Albareto cà Nova
- Bottazzi et al., Attorno al Monte Titano (739 m s.l.m.). Ricerche archeologiche e paleoambientali in Repubblica di San Marino
- Conversi et al., Il sito tardoatico – medievale d’altura della Piana di S. Martino , Pianello Val Tidone (PC)
- Cortesi et al., Archeologia dei paesaggi in una vallata appenninica: il progetto “Val Fantella” (Premilcuore, FC)
- Barbariol, Farms abandonment in Iceland
- Garattoni, Doss Penede (Nago, TN): progettare e costruire un insediamento minore nell’Alto Garda in epoca romana
- Santandrea, Detecting and Mapping Hilltop Sites between the Cesano, Misa, and Nevola River-Valleys
- Bonazzi et al., “Media Valle del Cedrino”: a region between uplands and plateaus
- Zanotti, Back to Monte della Croce
- Monticone et al., Un approccio di archeologia museale al ri-studio del sito neolitico di Chiomonte-La Maddalena (Piemonte, Italia). Revisione ed aggiornamento dei dati dal 1988 al 2023.
- Facciani et al., Exploring the funerary landscape of the Samarkand piedmont area
- Kaur and Poddar, Colonial Churches of Shimla: Public Archaeology as a Tool for Engagement and Outreach
- Datta, Upland Buddhist Monastic Complexes and the Pala Kingdom: Reviewing the Highland-Lowland Relationships in Ancient Bengal
- Staff
- Contacts
- Events calendar
- Seminars Apri sottomenù
- NEWS Apri sottomenù
Facciani et al., Exploring the funerary landscape of the Samarkand piedmont area
University of Bologna and Uzbek Ministry of Tourism and Cultural Heritage
Sara Facciani (1), Valentina Orrù (1), Eleonora Serrone (1), Samaretdin Suyunov (2), Eugenio Bortolini (1), Simone Mantellini (1)
(1) University of Bologna, (2) Uzbek Ministry of Tourism and Cultural Heritage
Introduction
This paper presents the preliminary results of the investigation on the funerary landscape in the Karatyube piedmont region, located around 30 km South-west of Samarkand city, Uzbekistan. This research is conducted within the framework of the Uzbek-Italian Archaeological Project “Samarkand and Its Territory”, aimed at understanding the settlements dynamics and the landscape evolution of a central place along the ancient Silk Road in a diachronic perspective (Berdimuradov et al., 2007; Genito and Mantellini, 2017; Mantellini, 2017; Mantellini et al., 2011; Mantellini and Berdimurodov, 2023; Stride et al., 2009; Tosi et al., 2007).
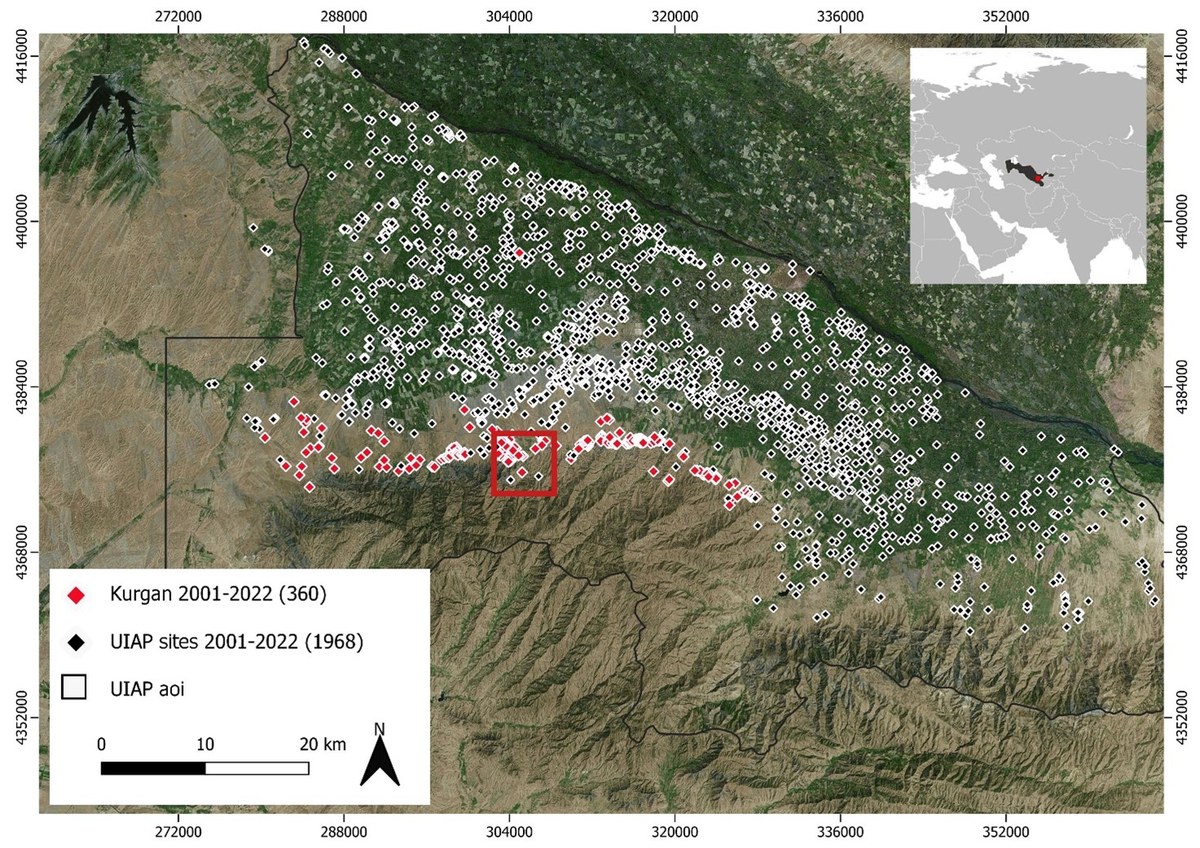
Figure 1. The region of Samarkand with the UIAP sites 2001-2022 and the area of Sazagan discussed in detail below (basemap BING satellite image 2022; © UIAP)
The Middle Zeravshan Valley can be seen as a mosaic of different ecological zones, offering for a wide breadth of land use strategies (Rondelli and Tosi, 2006; Shirinov and Tosi, 2003). The most common archaeological features are (Mantellini, 2019, 2018):
- multilayered artificial mounds (tepa) testifying to a permanent and long-term occupation, raising for some meters above the ground level;
- small and lower stone mounds, locally known as kurgan, usually marked by a circular shape, used as individual or multiple burials/cenotaphs.
Methods
The traditional methodology applied to the study of the archaeological landscape, based on the preliminary identification of potential anthropic features through remote sensing and historical maps, is less informative in the region, as kurgan are difficult to detect, due to their limited extension and height (Mantellini and Berdimuradov, 2019). Surface data collection through survey is also severely limited by the relatively small amount of artefacts, including pottery, that can be retrieved around kurgan, which (if not violated) can be considered as almost sealed contexts. Consequently, the methodology to be applied requires a comprehensive fieldwork approach able, on the one hand, to identify any archaeological evidence and material, as well as to accurately describe the physical characteristics of the evidence.
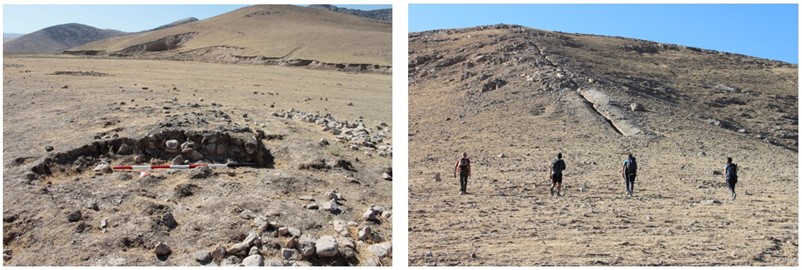
Figure 2: Detail of the half-destroyed kurgan Nur-224 (left) and field walking by parallel lines in the area of investigation (right).
Field activities therefore consisted of a systematic pedestrian exploration, aimed at identifying and recording every minimal archaeological evidence. Applications as AlpineQuest Pro and QField were used to record every single evidence and to track its size respectively. These tools greatly facilitate the collection of data as they synchronize with QGIS desktop projects and ensure the secure transfer, management, and processing of all acquired data.
The Piedmont oasis of Sazagan: data processing and analysis
This research focuses on a sample area corresponding to the small fan-shaped piedmont oasis of Sazagan (740-1395 m a.s.l.), extended over ca. 40 square km. This area was little investigated in the past (Franceschini, 2007; Obelchenko, 1973, 1966). The intensive research conducted by the UIAP has detected 102 sites, predominantly kurgan, and only six tepa (Mantellini et al., 2023). The case study has been selected to test a combined approach using field collection and different methods designed to identify potential spatial patterns.
Each GPS point corresponding to a cluster of kurgan has been included as a vector layer into QGIS. In order to apply spatial and statistical analysis on them, a Digital Elevation Model (DEM) was required. Since the available Global DEMs do not have sufficient resolution, we generated a precise DEM based on rasterized Soviet cartography at a 1:10.000 scale.
We digitized contour lines assigning to each of the polylines a numerical value representative of the corresponding altitude. The final layer comprises a total of 4037 polylines. To minimize loss of information, we also created a vector layer with listed ground points reported in the original maps and added them to the points extracted from contour lines, for a total of 185,084 elements. Four DEMs were interpolated through QGIS and Global Mapper, using both polylines and points. Each DEM was compared with the global DEM ASTER and SRTM.
The DEM were subjected to two preliminary analyses, slope and aspect, in order to obtain a raster base in subsequent spatial and statistical analyses. In this process, the accuracy of the data is essential as demonstrated by the Least-cost Path Analysis - LCPA between the only tepa in the foothills of Sazagan and the tepa closest to the downstream.
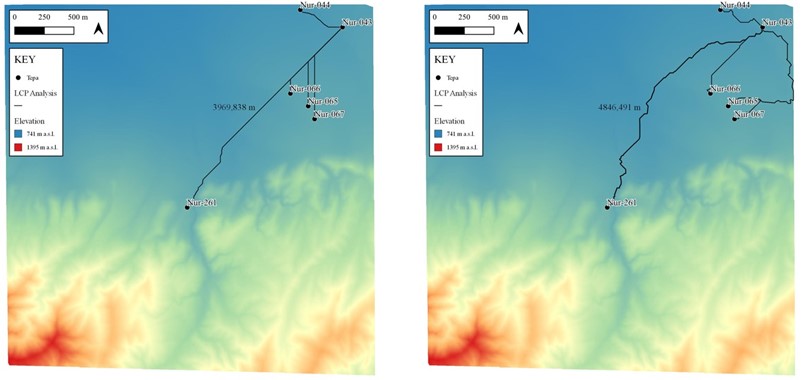
Figure 3: LCPA on DEM (on the left) and on slope raster (on the right).
Viewshed analysis allowed us to calculate the visual space of an observer placed at each tepa excluding areas obscured by natural obstacles. As one of the objectives of the research is to understand the relationship between the distribution of ancient settlements and the surrounding environment, this analysis has proved to be particularly significant in determining the area potentially under the control of individual settlements and was conducted on Nur-261, the only settlement located at a higher altitude (837 meters asl). Results suggest that Nur-261, from its most prominent location, dominated the territory below which were exploited for agriculture as witnessed by the presence of several tepa formerly cultivated. The results of the viewshed analysis carried out on the sites in the northernmost belt seems to confirm the correlation between living and dead previously hypothesized: the cluster of burials identified to the east is clearly visible from Nur-043, Nur-044, Nur-065, Nur-066, and Nur-067. These sites are visually connected to a conspicuous number of burials located in the foothills, which may support the hypothesis of a strategic location of the tombs.
We estimated the concentration of the burials through Kernel Density Estimation (KDE) by setting a radius of 100 meters after having explored different widths. The analysis identified two areas with the highest concentration of mounds, located in the eastern and western parts of the investigated area, respectively. To the west, there are two alignments arranged along the north-south axis, one of which is particularly evident. To the east, a cluster of burials near tepa Nur-067 was identified.
Tentative statistical analyses have also been applied to the kurgan to extract additional information on their spatial distribution.
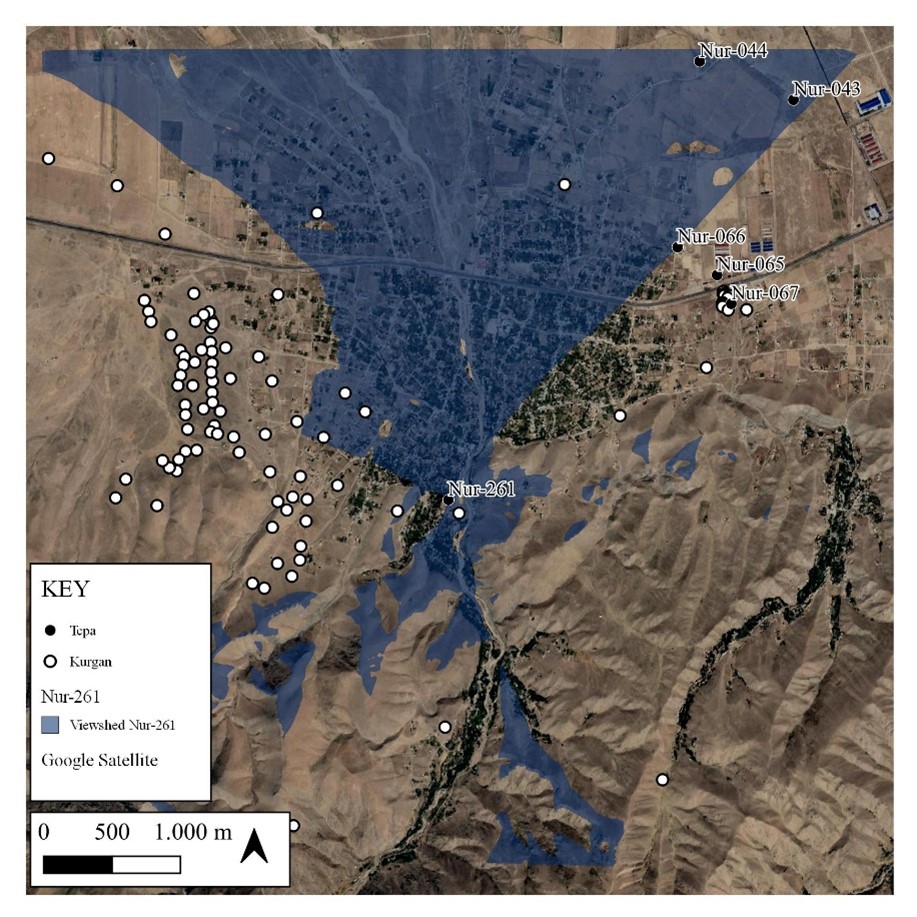
Figure 4: Viewshed analysis on Nur-261.
Following the example of Carrer (Carrer, 2013), the first stage involved the selection of potentially relevant independent, environmental variables. Two different methods were employed: first we generated 100 random points and used a Chi square test (χ2) to ascertain whether archaeological points were preferentially associated to specific intervals of values in four key variables (e.g. elevation, aspect, slope, and distance from the centroid of tepas), when compared to randomly generated locations. All the variables except aspect have a very asymmetric and unbalanced distribution. Specifically, the most frequent elevation for tombs is between 800 and 900 m asl, while above 900 m altitude burials recorded are virtually non-existent. Slope seems to show a preference for low values, while the distance from the centroid of tepa shows a kind of bimodal distribution, with a first peak (<1000m) and a second peak between 3 and 4 km. We then performed univariate logistic regression on categorical intervals obtained from the distribution of the initial variables, and used the significant ones to build an explanatory model through multivariate logistic regression with forward stepwise variable selection, to identify the set of variables with the highest explanatory power (I.e. the lowest Akaike Information Criterion, AIC) that could best describe the probability of finding/not finding a burial site at a given location. All analyses were performed using the package MASS in R version 4.2.2 (R Core Team 2022). Values for elevation, aspect and slope were extracted at each site location from the corresponding raster, while the remaining (derivative) value was calculated using QGIS algorithms.
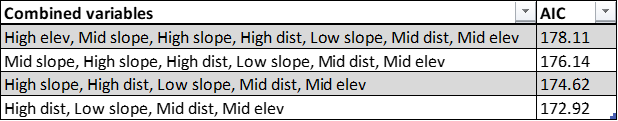
Figure 5: Different possible combinations of variables and their corresponding AIC values.
The results of the Chi squared test allowed us to discard aspect from the list of the informative independent variables. We then divided the remaining three variables into three intervals each based on their respective distribution, and explored each categorical variable through univariate logistic regression. Elevation has been divided into low elevation (700-800 m asl), medium elevation (800-900 m asl), and high elevation (900-1400 m asl). Distance has been divided into low distance (500-2000 m), medium distance (2000-4000 m) and high distance, which includes values above 4000. Following the same principle, slope angles were categorized into low slope (0-10°), medium slope (10-20°), and high slope (more than 20°). Each of the dummy variables was first tested individually using a dedicated univariate logistic regression. Based on the results obtained and the level of significance chosen (0.05) two out of nine variables, Low elevation and Low distance, were discarded. The resulting seven variables were used to build a model through multivariate logistic regression, which allowed us to choose the configuration of variables bearing the highest explanatory power for the observed spatial pattern. The model that best seems to predict the probability of finding burials includes the variables High distance, Medium distance, Low slope, and Medium elevation.
Preliminary results
The work presented is a first attempt of understanding the funerary landscape in one of the most important historical regions of Eurasia. The case study evidenced the need for an integrated approach, combining a systematic field data recording with hi-resolution spatial analyses, and a preliminary statistical approach. Data so far collected evidence a clear land use strategy, where the lowland was used for settlement and agricultural purposes, and the Karatyube piedmont as the place for burials throughout a very long period (Achaemenid, 6th-5th century BC – Late Middle Ages until modern times). Based on the results presented here, one of the possible future continuations of this research could be the development of a territorial predictive model: in this case the identification of variables that best predict the probability of identifying burials is particularly valuable.
References
Akaike, H., 1974, A new look at the statistical model identification. AutomaticControl, IEEE Transactions on, 19, 716–723
Berdimuradov, A., Franceschini, F., Giorgetti, D., Mantellini, S., Rondelli, B., Tosi, M., 2007. Samarkand and its Territory: from Archaeological Map to Cultural Landscape Management. Bull. IICAS 6, 22–33.
Carrer, F. 2013., An ethnoarchaeological inductive model for predicting archaeological site location: A case-study of pastoral settlement patterns in the Val di Fiemme and Val di Sole (Trentino, Italian Alps), Journal of Anthropological Archaeology, 32/1, 54-62.
Franceschini, F., 2007. I nomadi della Media Valle dello Zeravshan Territorio e identità culturale attraverso i tumuli funerari. University of Bologna.
Genito, B., Mantellini, S., 2017. Reading the Great Silk Road in the Samarkand Oasis from the Activities of the Uzbek-Italian Archaeological Expedition, in: Park, P. (Ed.), Civilizations of the Great Silk Road From the Past to the Future: Perspectives Through Natural, Social and Human Sciences. Proceedings of the International Academic Conference (Samarkand, 28-29 September 2017). IICAS, Samarkand, pp. 124–142.
Mantellini, S., 2019. Urbanscape vs. Landscape or Urbanscape as Landscape? A case from ancient Samarkand (Sogdiana), in: Baumer, C., Novák, M. (Eds.), Urban Cultures of Central Asia from the Bronze Age to the Karakhanids. Proceedings of the First International Congress on Central Asian Archaeology Held at the University of Bern, 4–6 February 2016, Schriften Zur Vorderasiatischen Archäologie 12. Harrassowitz Verlag, Wiesbaden, pp. 185–202.
Mantellini, S., 2018. Landscape Archaeology and Irrigation Systems in Central Asia: A View from Samarkand (Uzbekistan), in: Marchetti, N., Domenici, D. (Eds.), Urbanized Landscapes in Early Syro-Mesopotamia and Prehispanic Mesoamerica. Papers of a Cross-Cultural Seminar Held in Honor of Robert McCormick Adams (Bologna, February 9-10, 2015). Harrassowitz Verlag, Wiesbaden, pp. 169–203.
Mantellini, S., 2017. A city and its landscape across time: Samarkand in the ancient Sogdiana (Uzbekistan), in: Garagnani, S., Gaucci, A. (Eds.), Knowledge, Analysis and Innovative Methods for the Study and the Dissemination of Ancient Urban Areas. Proceedings of the KAINUA 2017 International Conference in Honour of Professor Giuseppe Sassatelli’s 70th Birthday (Bologna, 18-21 April 2017). All’Insegna del Giglio, Firenze, pp. 333–342. https://doi.org/10.19282/AC.28.2.2017.26
Mantellini, S., Berdimuradov, A.E., 2019. Evaluating the human impact on the archaeological landscape of Samarkand (Uzbekistan): A diachronic assessment of the Taylak district by remote sensing, field survey, and local knowledge. Archaeol. Res. Asia 20, 100143. https://doi.org/10.1016/j.ara.2019.100143
Mantellini, S., Berdimurodov, A., 2023. The Archaeological Map of the Middle Zeravshan Valley. The Southern Sector. Volume I: Samarkand City. Fondazione Bologna University Press, Bologna.
Mantellini, S., Rondelli, B., Stride, S., 2011. Analytical Approach for Representing the Water Landscape Evolution in Samarkand Oasis (Uzbekistan), in: Jerem, E., Redő, F., Szeverényi, V. (Eds.), On the Road to Reconstructing the Past. Computer Applications and Quantitative Methods in Archaeology (CAA). Proceedings of the 36th International Conference. Budapest, April 2-6, 2008. Archaeolingua, Budapest, pp. 387–396.
Mantellini, S., Suyunov, S., Orrù, V., Serrone, E., Facciani, S., 2023. Archaeological Survey Along the Karatyube Piedmont, Samarkand: Preliminary Result of the 2019 and 2021 UIAP Field Seasons. O’zbekist. Arxeologiyasi 27.
Obelchenko, O. V, 1973. Kurgany v okrestnostyakh Samarkanda, in: Gulyamov, Y.G. (Ed.), Afrasiab II. FAN, Tashkent, pp. 157–173.
Obelchenko, O. V, 1966. Sazaganskie kurgany. Istor. Mater. Kult. Uzb. 7, 66–81.
Rondelli, B., Tosi, M., 2006. Gis and Silk Road Studies: Monitoring Landscape and Population Changes At Samarkand and in the Middle Zeravshan Valley, in: Uno, T. (Ed.), Reading Historical Spatial Information from around the World. Studies of Culture and Civilization Based on Geographic Information Systems Data. Kyoto, February 7-11 2005. International Research Center for Japanese Studies, Kyoto, pp. 459–489.
Shirinov, T., Tosi, M., 2003. Land behind Samarkand. The Archaeological Map of the Middle Zeravshan Valley: Perspectives and Geographical Repartitions, in: Pagani, S. (Ed.), Italo-Uzbek Scientific Cooperation in Archaeology and Islamic Studies: An Overview. Papers from the International Conference (Roma). Istituto Italiano per l’Africa e l’Oriente, Rome, pp. 13–40.
Stride, S., Rondelli, B., Mantellini, S., 2009. Canals versus horses : political power in the oasis of Samarkand. World Archaeol. 41, 73–87. https://doi.org/10.1080/00438240802655302
Tosi, M., Berdimuradov, A., Franceschini, F., Giorgetti, D., Mantellini, S., Rondelli, B., 2007. La Carta Archeologica della Media Valle dello Zeravshan: Strategie e Metodi per la Storia del Popolamento nella Regione di Samarcanda, in: Shirinov, T.S., Pidayev, S.R. (Eds.), The Role of Samarkand in the History of World Civillization. Materials of the International Scientific Symposium Devoted to the 2750th Anniversary of the City of Samarkand. FAN, Tashkent-Samarkand, pp. 68–73.