Comparisons with standard EN 52016
With the aim to have an additional benchmark of the ALMABuild library, a comparison with EnergyPlus and the hourly method proposed by the recent European Standard EN ISO 52016 has been performed.
The BESTEST qualification cases are considered for this comparisons. Predictions of the annual heating and cooling energy demand and power peak obtained with EnergyPlus are available for the version 8.3.0 whilst in standard EN 52016 are collected the results obtained with the hourly method proposed only for Cases 600, 640, 900 and 940.
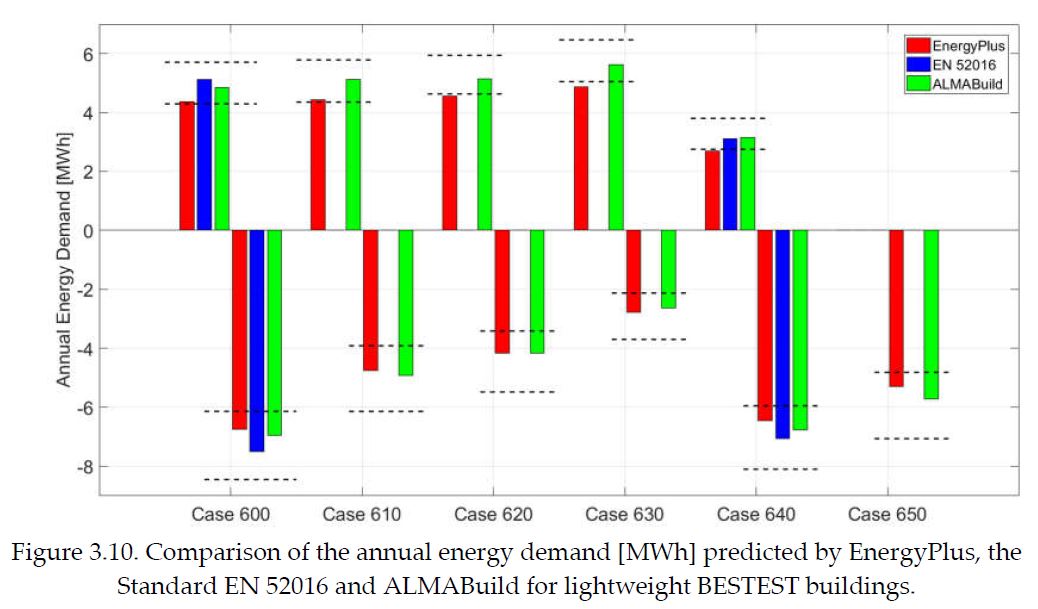
In the following Figure the annual energy demand for heating (positive values) and cooling (negative values) predicted by EnergyPlus, standard EN 52016 and ALMABuild for the lightweight cases are shown together with the minimum and maximum BESTEST threshold values (dashed lines) for these cases.

From this figure it is possible to appreciate that the results obtained with the new hourly method described by EN ISO 52016, like the ALMABuild results, are within the BESTEST range, whilst
EnergyPlus do not. More in detail, EnergyPlus slightly underestimates the annual heating load for Cases 620, 630 and 640; on the contrary, the predicted annual cooling load is always included within the BESTEST range. Discrepancies between ALMABuild and EnergyPlus go from 10% (Case 600) to 15% (Case 640) for the heating loads, whilst for the cooling energy demand deviations are lower than 5%, except for Case 630, for which the difference between ALMABuild and EnergyPlus is 6%. Also the results obtained with the European Standard are close to the ALMABuild predictions: the maximum deviation, equal to 8%, is observed for the evaluation of the cooling load in Case 600.
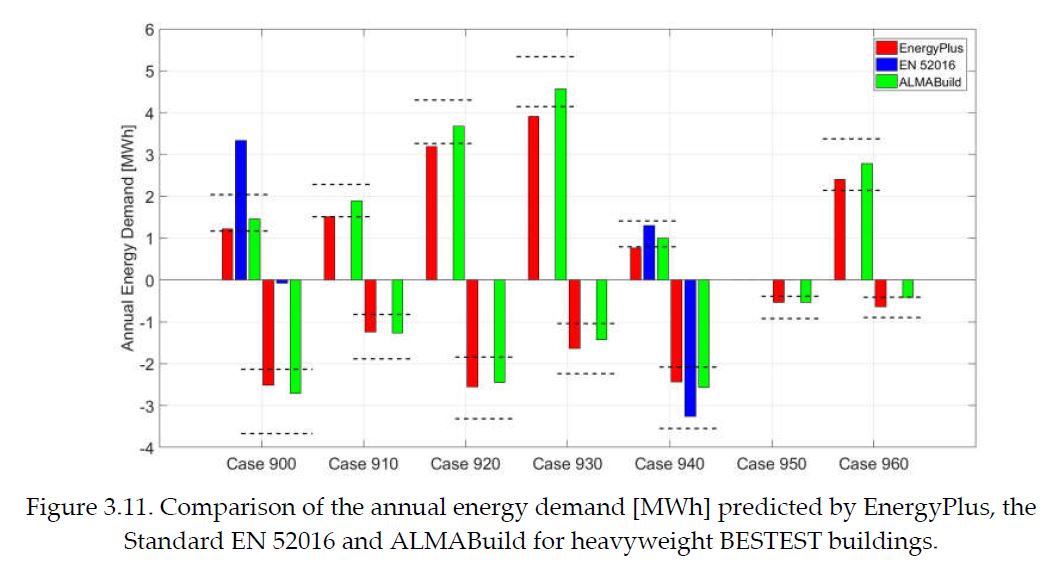
Predictions of the annual energy demand for the BESTEST heavyweight buildings and the multizone case, obtained with ALMABuild and the additional references are reported in the Figure below.

From the above Fgure it can be noted that ALMABuild results are within the BESTEST range, whilst EnergyPlus and EN 52016 do not. Again, as for lightweight buildings, the EnergyPlus annual heating loads are always around the minimum BESTEST threshold values, and from Case 910 to Case 940 the predictions from EnergyPlus are lower than the BESTEST range. On the contrary, the evaluation of the cooling energy demand by means of EnergyPlus is always within the BESTEST range. Comparing EnergyPlus and ALMABuild heating demand predictions, the minimum deviation is observed for Case 920 (+13%), whilst the maximum difference occurs for Case 940 (+23%). On the contrary, regarding the annual cooling loads, discrepancies are around 5%, except in Case 930 (-15%) and Case 960 (-54%).
Considering the EN 52016 results, it can be noted that, for Case 940 predictions are within the BESTEST range, even if a large discrepancy with ALMABuild, around 30% for both the cooling and heating demand there exists. However, in Case 900, EN 52016 predictions are very far from the BESTEST range: the heating demand is too high (+129% with respect to ALMABuild) and
the cooling load is too low (-97%).
The predictions of the heating and cooling peak load delivered by the ideal HVAC system for lightweight buildings show a good agreement among the different numerical method considered. In fact, for ALMABuild, EnergyPlus and EN 52016 the results are always contained within the BESTEST range. Moreover, the discrepancies between ALMABuild and EnergyPlus are around 0.5% for the heating peak load and around 5% for the cooling one, except the heating peak load evaluation in Case 640, for which a deviation of 14% is observed. Comparing the EN 52016 predictions to the ALMABuild ones, deviations are around 20% and 6% for the heating and cooling peak loads, respectively.
The comparison between ALMABuild and the hourly model proposed by EN 52016 shows how the predictions of EN 50126 for heavyweight buildings are significantly out from the BESTEST range (and far from the results obtained with ALMABuild), revealing some problems to model correctly the thermal inertia of buildings.