Action 3b: Monitoring of bedload transport
i) Preparation of tracers
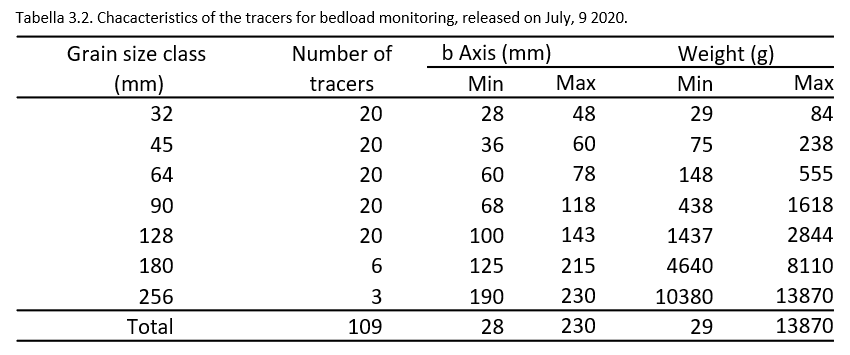
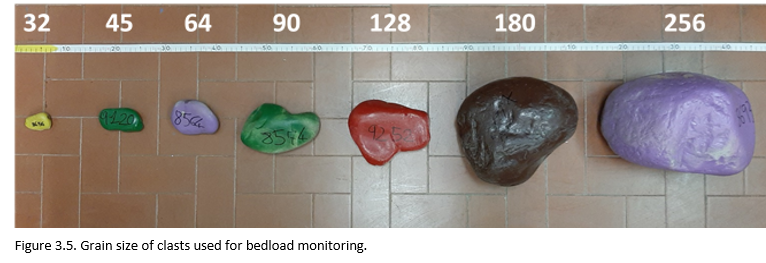
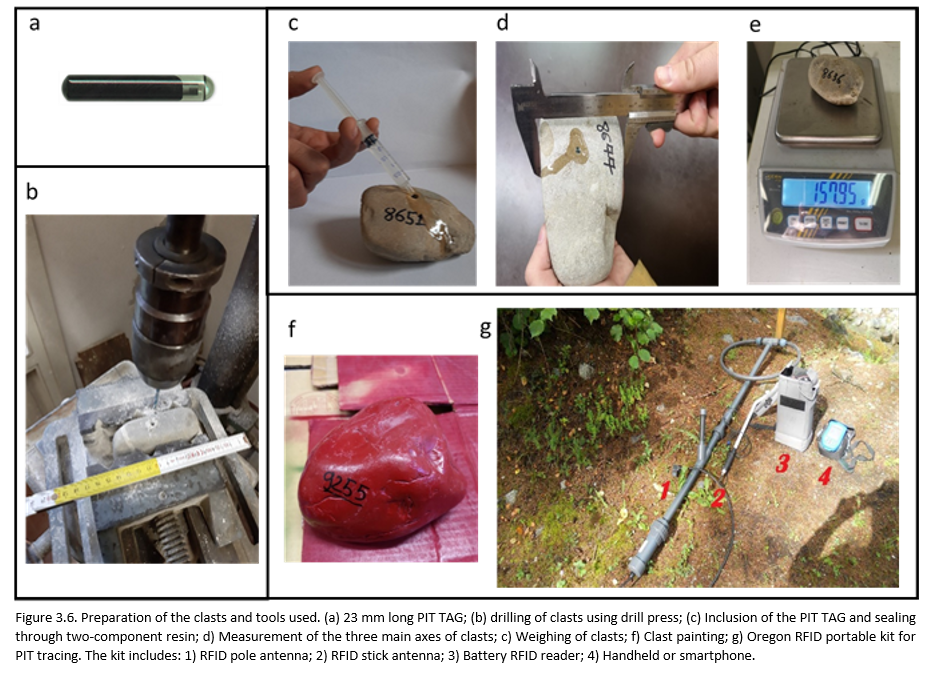
The bedload is monitored through RFID technology applied to clasts, with different grain sizes (Tab. 3.2 and Fig. 3.5), in which passive transponders (PIT) with unique identification code are implanted (Fig. 3.6a).
The clasts are drilled (Fig. 3.6b) to allow the insertion of the transponder, which is fixed through a two-component epoxy resin (Fig. 3.6c). After inserting and fixing the transponder with the resin, the axes A (major axis), B (middle axis) (Fig. 3.6d) and C (minor axis) of the clasts are measured and they are weighed (Fig. 3.6e).
Once the measurements are completed, the clasts are painted and marked with the last 4 digits of the RFID transponder identification code (Fig. 3.6f), in order to semplify the identification in future monitoring, carried out through a portable RFID antenna (Fig. 3.6g).
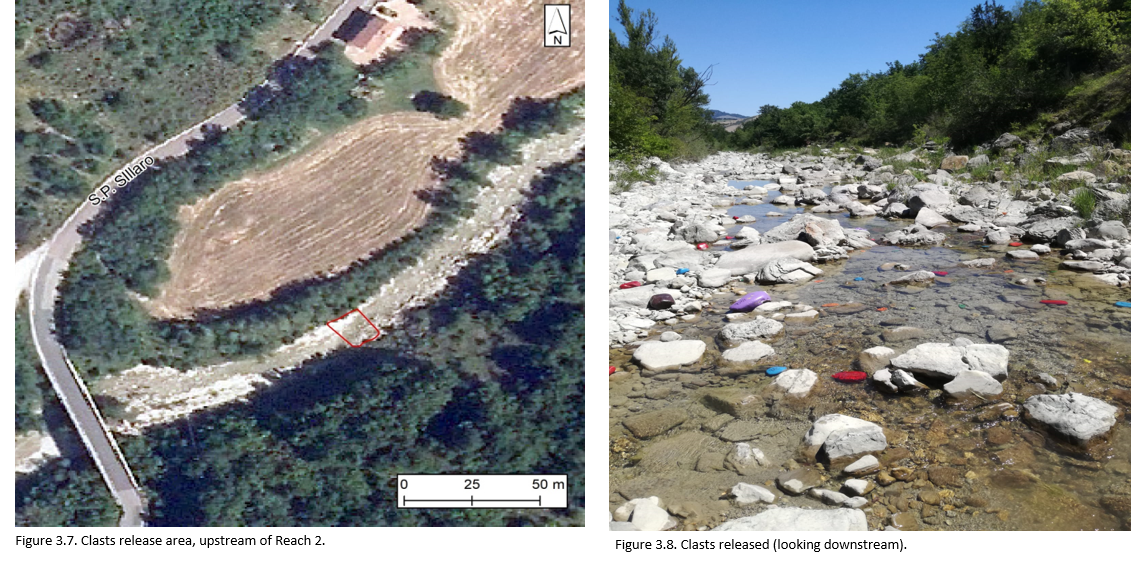
The clasts were released on July, 9 2020 starting from upstream end of Reach 2 (Fig. 3.7).
They were randomly placed in eight different rows, perpendicular to the direction of water flow (Fig. 3.8), the position of each clast was marked by differential GPS.
ii) Topographic and photogrammetric monitoring of the river bed
The activity consists of topographical and photogrammetric surveys conducted in two reaches of the river characterized by different degree of lateral confinement: a first semi-confined reach (reach 1), a second confined reach and affected by active landslides, located further downstream (reach 2) (Figure 3.1).
Approximately 50 metres upstream of reach 2 (Figure 3.1) a hydrometric monitoring station has been installed. The pluviometric reference is represented by the San Clemente station, located about 2.5 km downstream.
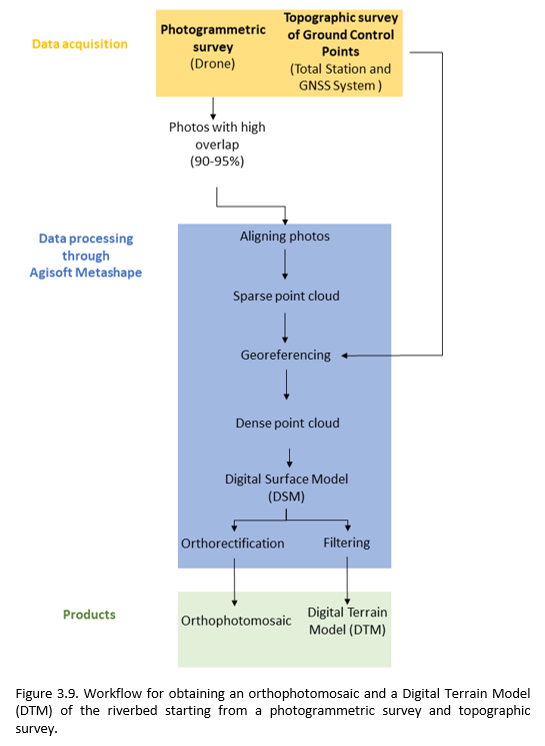
The topographic monitoring is carried out through aerial photos by drone, where a set of Ground Control Points (GCPs) is georeferenced using total station.
Subsequently the elaboration of the images was performed, the Ground Control Points (GCPs) were used to obtain an orthorectified photogrammetric mosaic and a digital model of the river-bed, following the workflow shown in Figure 3.9.
The surveys were carried out on November, 7 and 9 2019 and were repeated in early May 2020.
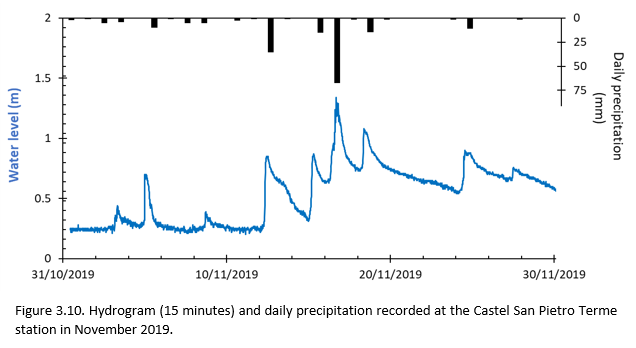
They include the assessment of the volumes of degradation (erosion) and aggradation (deposition) related to rainfall events. The peak flow rate was recorded on November, 17 2019, with reference to the hydrometric and pluviometric station of Castel San Pietro Terme (Figure 3.10). In the monitoring reach 2, this event caused gravel deposition above the bankfull level.
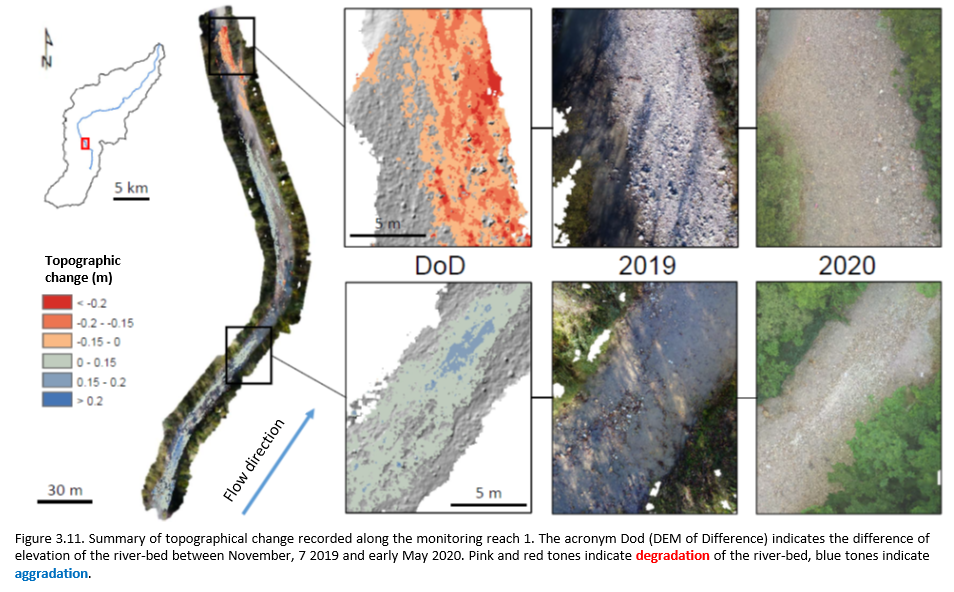
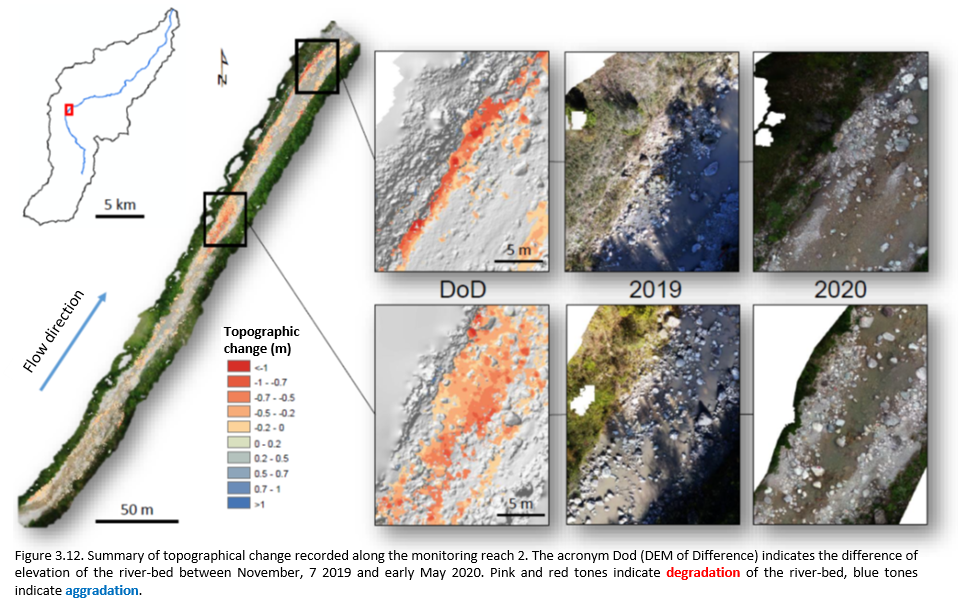
The subtraction between the DTM at the beginning of May 2020 and the beginning of November 2019 shows interesting differences (Table 3.3, Figure 3.11 and Figure 3.12). In reach 1 (upstream), characterized by riffle-pool and plane bed morphology and slope of 0.82%, there is a substantial dominance of deposition dynamics, for a net change of + 92 m3. In reach 2 (downstream), characterized by step-pool and plane bed morphology and slope of 1.13%, there is a drastic dominance of erosive dynamics, with a net change of -303 m3 (Table 3.3).

iii) Monitoring of bedload via tracers
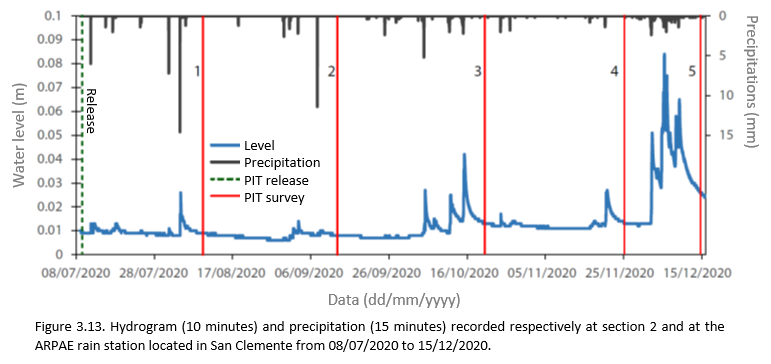
The activity includes the release of tracers and 5 post-event surveys, carried out to monitor over time their position in the channel (Table 3.4 and Figure 3.13). A first exploratory set of 109 tracers (Table 3.2) was released in the river-bed on July, 9 2020 at the downstream monitoring reach (reach 2) (Figure 3.13). The release was made by placing the clasts along eight rows, transverse to direction of talweg. The position of each clast (latitude, longitude and altitude) was acquired via differential GPS.
No movement or burial of tracers was recorded in the first two surveys. In the third survey (21/10/2020) there was the mobilization of 6 tracers and a maximum movement of 60 cm.
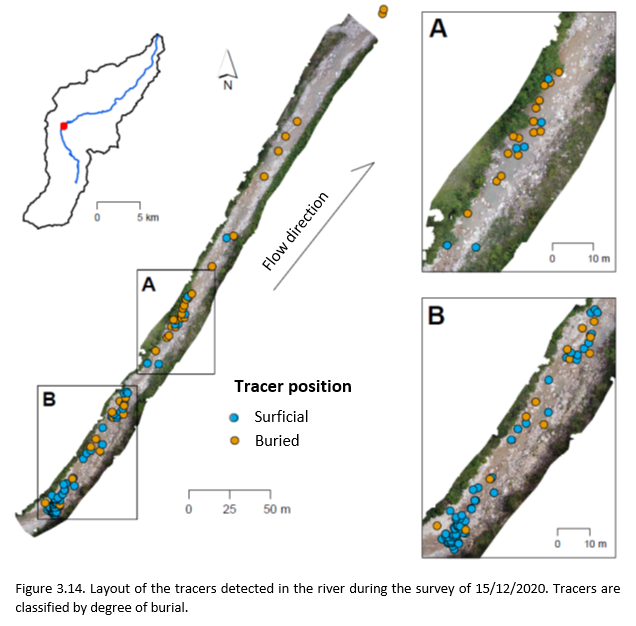
Finally, the last survey (15/12/2020), carried out after several close rainfall events (Figure 3.13), recorded the complete reorganization of the 109 tracers released.

All 99 tracers identified have moved relative to their release positions or their previous positions. While the finding rate shows no dependence on the size of the intermediate axis of the tracers, the burial rate decreases dramatically for tracers with intermediate axis greater than 64 mm, and is zero for class 256 mm (Figure 3.14).